 ← AlgoxFlow
What is implied volatility (IV)?
Implied volatility is the number that decides whether an option is cheap or expensive — and it's the one most new traders ignore right up until it wipes out a winning trade. The good news: the idea behind it is simple, and one picture makes it stick.
Implied volatility (IV) is the market's forecast of how big a stock's move will be — the expected size of the swing — baked into the price of its options. High IV = expensive options and a large expected move. Low IV = cheap options and a calm expected move. Crucially, IV measures the size of the move, not the direction.
Why is it called "implied"?
You can't measure future volatility directly — it hasn't happened yet. So the market works backward: it takes the actual price people are paying for an option right now and solves for the volatility number that would justify that price. That back-solved figure is the volatility the price implies — hence implied volatility. In plain terms: IV is expensive options translated into a percentage. When demand for options rises, prices rise, and IV rises with them.
IV is about size, not direction
This is the part that trips people up. A high IV does not mean the stock is going up, and it doesn't mean it's going down. It means the market expects a big move either way. That's why the expected-move cone above fans out symmetrically. If you're bullish, IV doesn't confirm you — it just tells you how much you're paying for the ticket and how far the crowd thinks the stock could travel.
What high vs low IV means for you
| Low IV | High IV | |
|---|---|---|
| Option prices | Cheap | Expensive |
| Expected move | Small / calm | Large / jumpy |
| Good for… | Buyers (you pay less) | Sellers (you collect more) |
| Main risk | Move may be too small to profit | IV crush — premium deflates when it drops |
| Typical when… | Quiet, no catalyst | Before earnings / events / market fear |
Is this IV actually high? Use IV Rank
A raw IV of 45% means nothing on its own — it might be sky-high for a sleepy utility and dirt-cheap for a biotech. That's what IV Rank (and IV Percentile) fix: they compare today's IV to that same stock's own range over the past year. High IV Rank = options are expensive relative to this stock's history; low IV Rank = cheap. It's the difference between "45%" and "the most expensive this stock's options have been all year."
IV crush — where this becomes real money
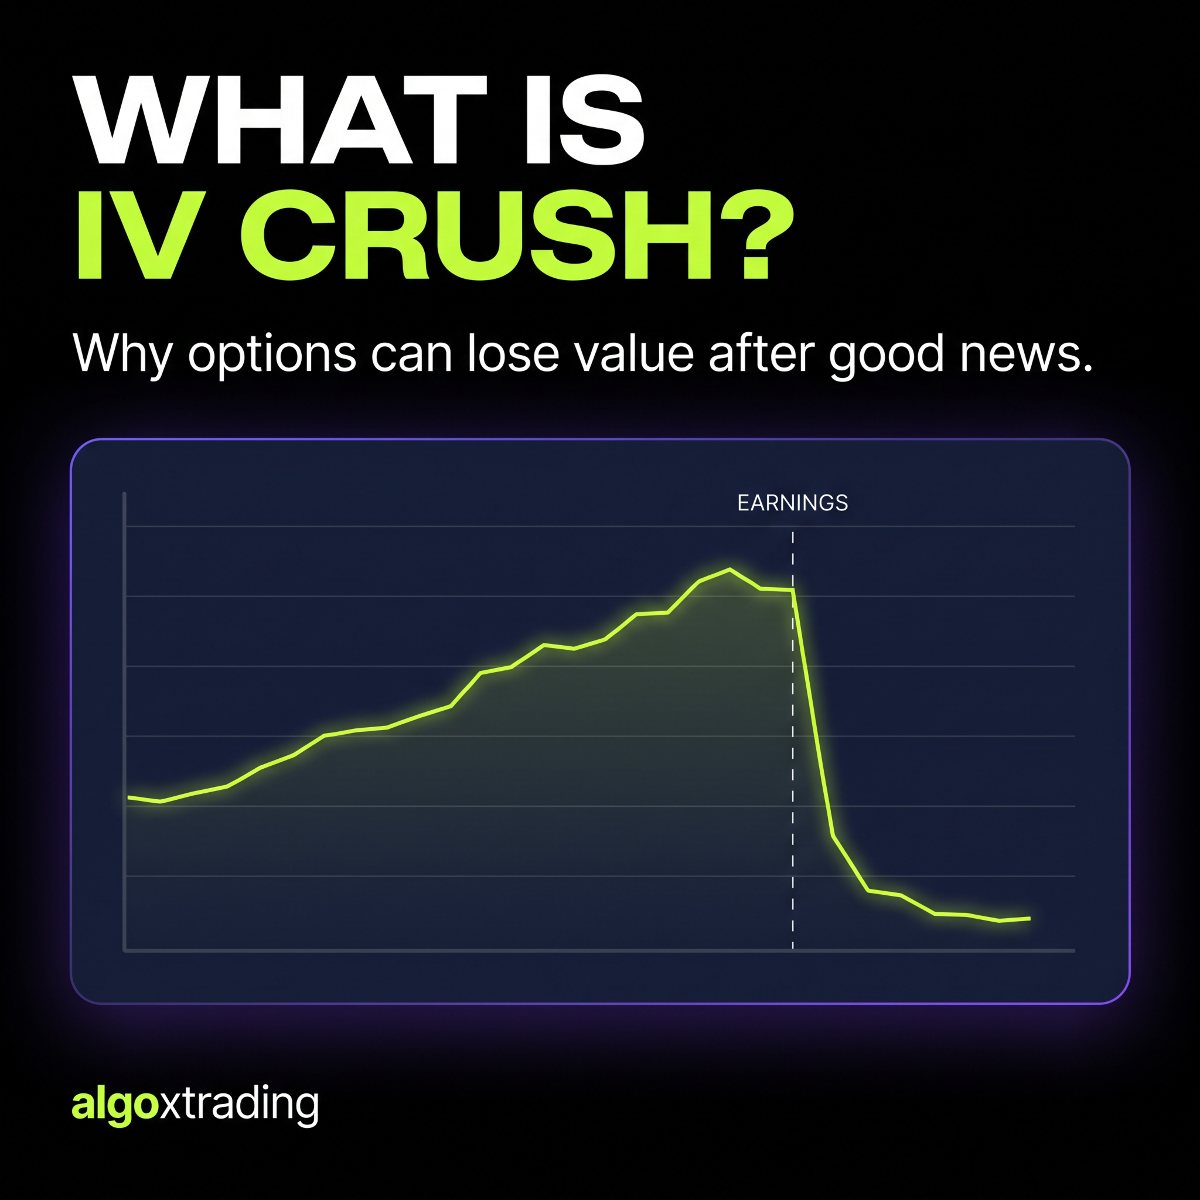
The most common way IV burns traders is around earnings. IV inflates before the report (nobody knows the outcome), then collapses the instant it's public. Buy a call into that spike and the stock can rise on the news while your option still loses — because the IV you paid for evaporated. That exact mechanism, with the math, is broken down here:
Frequently asked
What does IV mean in options?
IV stands for implied volatility — how much movement the options market is currently pricing into a stock over the next year, quoted as an annualised percentage. An IV of 40 means options are priced as though the stock will move roughly 40% over a year, in either direction. It's called "implied" because it isn't measured from past prices; it's reverse-engineered out of what people are actually paying for the options right now.
How is implied volatility calculated?
It's solved for, not computed. A pricing model like Black-Scholes takes stock price, strike, time to expiration, interest rate and volatility, and returns a theoretical option price. Every input except volatility is known — and the option's real market price is known too. So you run the model backwards to find the volatility number that makes theory match the market. That number is the IV. Because it's solved iteratively, there's no clean closed-form formula for it.
What IV is considered high?
There's no universal number, because normal for one stock is extreme for another. An index ETF might sit at 12–18; a biotech routinely trades above 80. Neither is unusual for that name. That's why IV Rank beats raw IV — it tells you where today's IV sits inside that stock's own past year. Above ~50% IV Rank is genuinely high for that name, below 20 is cheap, whatever the headline number says.
IV also sets the expected move — how far the options are pricing the stock to travel today. That number is only half the picture though: it tells you the expected size, not whether dealer hedging will damp the move or amplify it. Our free market regime tracker puts the two together, measuring how far each index sits from its zero-gamma flip in units of its own expected move. You can also size any single move with the implied move calculator.
What is IVX?
IVX (Implied Volatility Index) is a single blended IV figure for a stock, calculated across many strikes and expirations and normalised to a fixed horizon — usually 30 days. One contract's IV only describes that contract; IVX compresses the whole surface into one comparable number, which is what makes it useful for tracking a stock against itself over time, or against other stocks.
Is high implied volatility good or bad?
It depends which side you're on. High IV makes options expensive — good for sellers collecting rich premium, risky for buyers who pay up and face IV crush when volatility falls. Low IV means cheap options, better for buyers. Neither is inherently good or bad; it decides who has the edge.
Does high IV mean the stock will go up?
No. IV measures the expected size of the move, not its direction. High IV means the market expects a big move either way — which is why the expected-move range is symmetric around the current price.
What is a good IV level for options?
There's no universal number — a normal IV for a quiet stock is high for another. Traders use IV Rank or IV Percentile, which compare today's IV to that same stock's past year. High IV Rank means expensive relative to its own history; low means cheap.
What causes implied volatility to rise?
Uncertainty. IV rises ahead of earnings, events, big news, or broad market fear (the VIX is basically IV on the S&P 500). When the uncertainty resolves, IV usually collapses — the IV crush that hurts option buyers.
Watch IV called out on live trades
We flag when IV is rich or cheap before the trade in the free Discord — so you're not the one buying the top of the volatility spike. 3,600 traders, wins and losses posted. See it before you risk a cent.
Get the morning's biggest flow in your inbox
The top conviction names, the day's key levels and the heaviest options flow — free, every morning. No card, no Discord required.
No spam. Unsubscribe anytime. Just the daily flow.