 ← AlgoxFlow
What is GEX (gamma exposure)?
GEX is the reason SPY can chop in a tiny range for a week and then, one day, fall out of bed with no news. Same market, totally different behavior — and the switch that flips between them is dealer gamma. Once you see it, you can't un-see it.
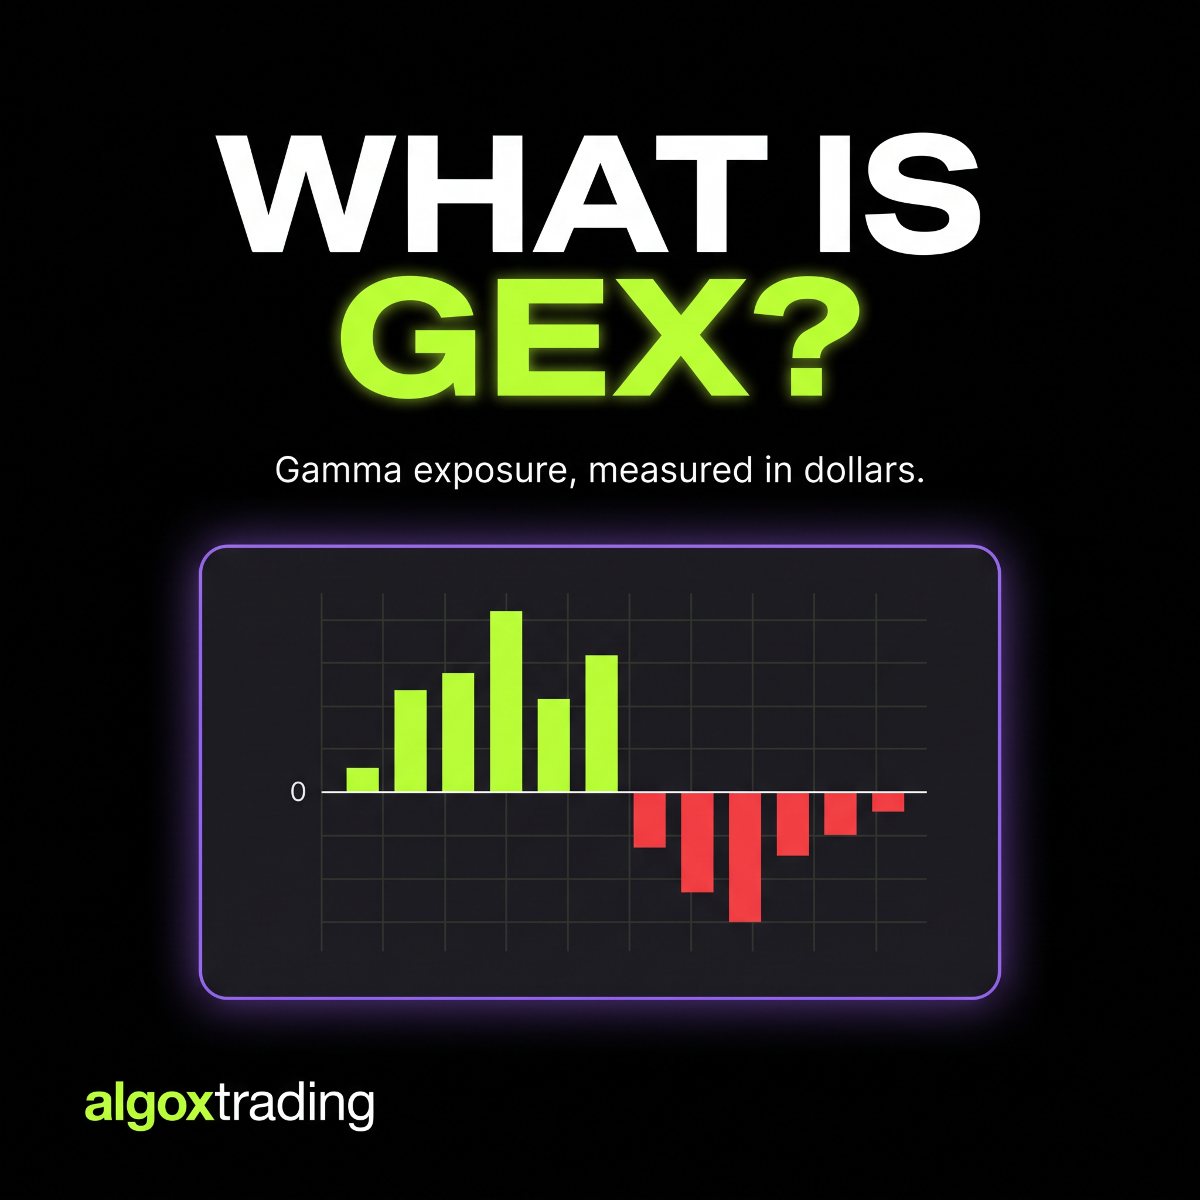
GEX (gamma exposure) measures the net gamma that options dealers are forced to hedge. When it's positive, dealers sell strength and buy weakness — which suppresses volatility and pins price toward big strikes. When it's negative, they chase the move — buying strength, selling weakness — which amplifies volatility and lets moves trend and extend. GEX isn't a direction call; it's a map of the forced flows under the tape.
Who are "the dealers," and why do they hedge?
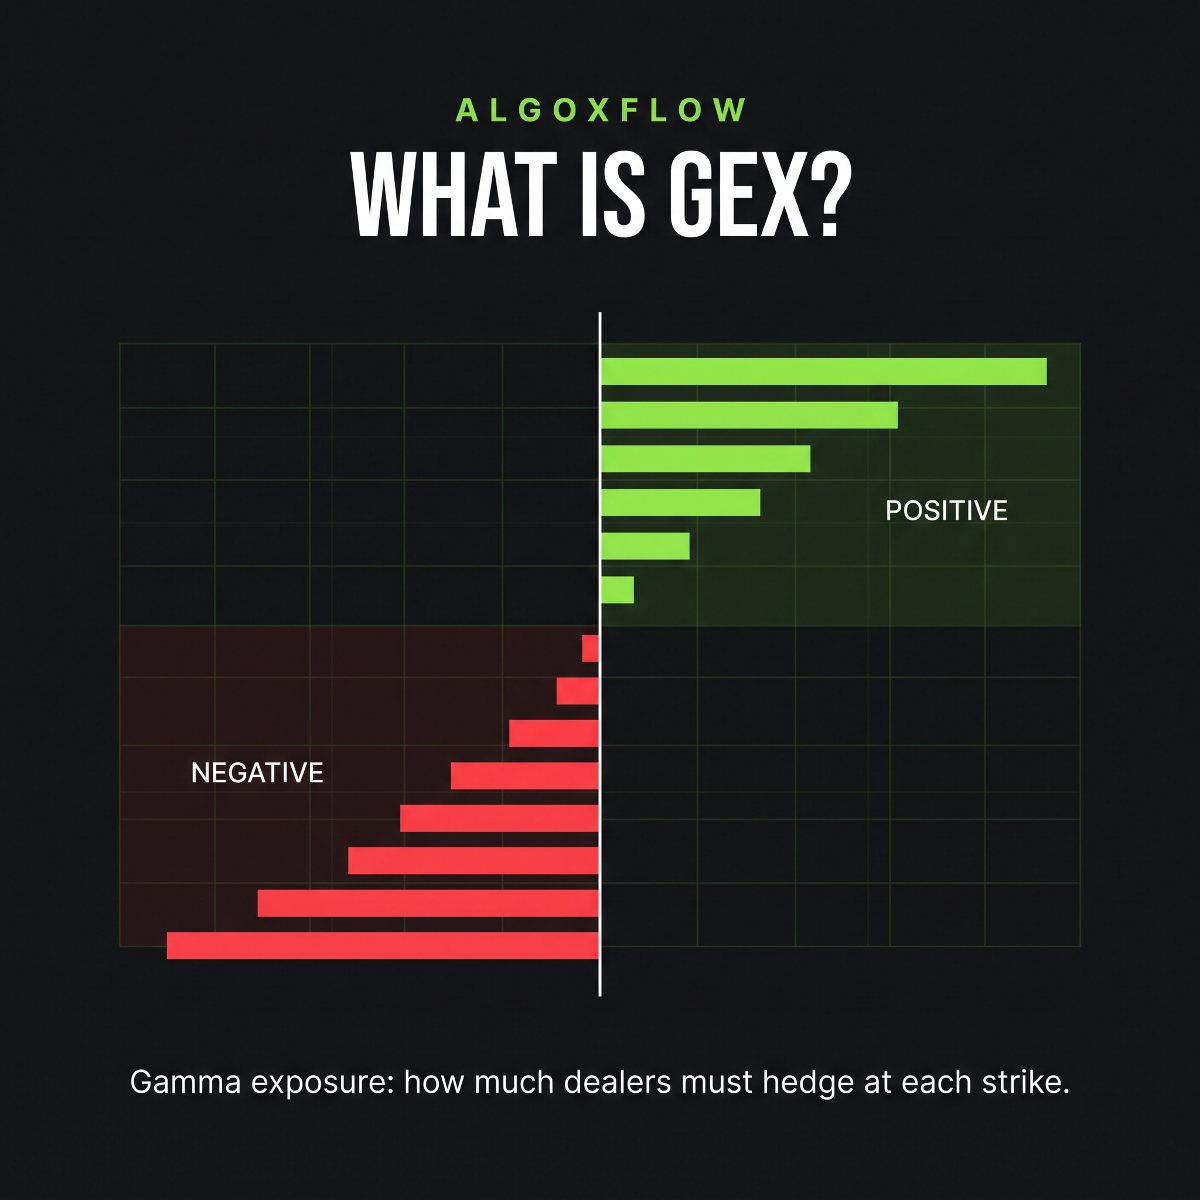
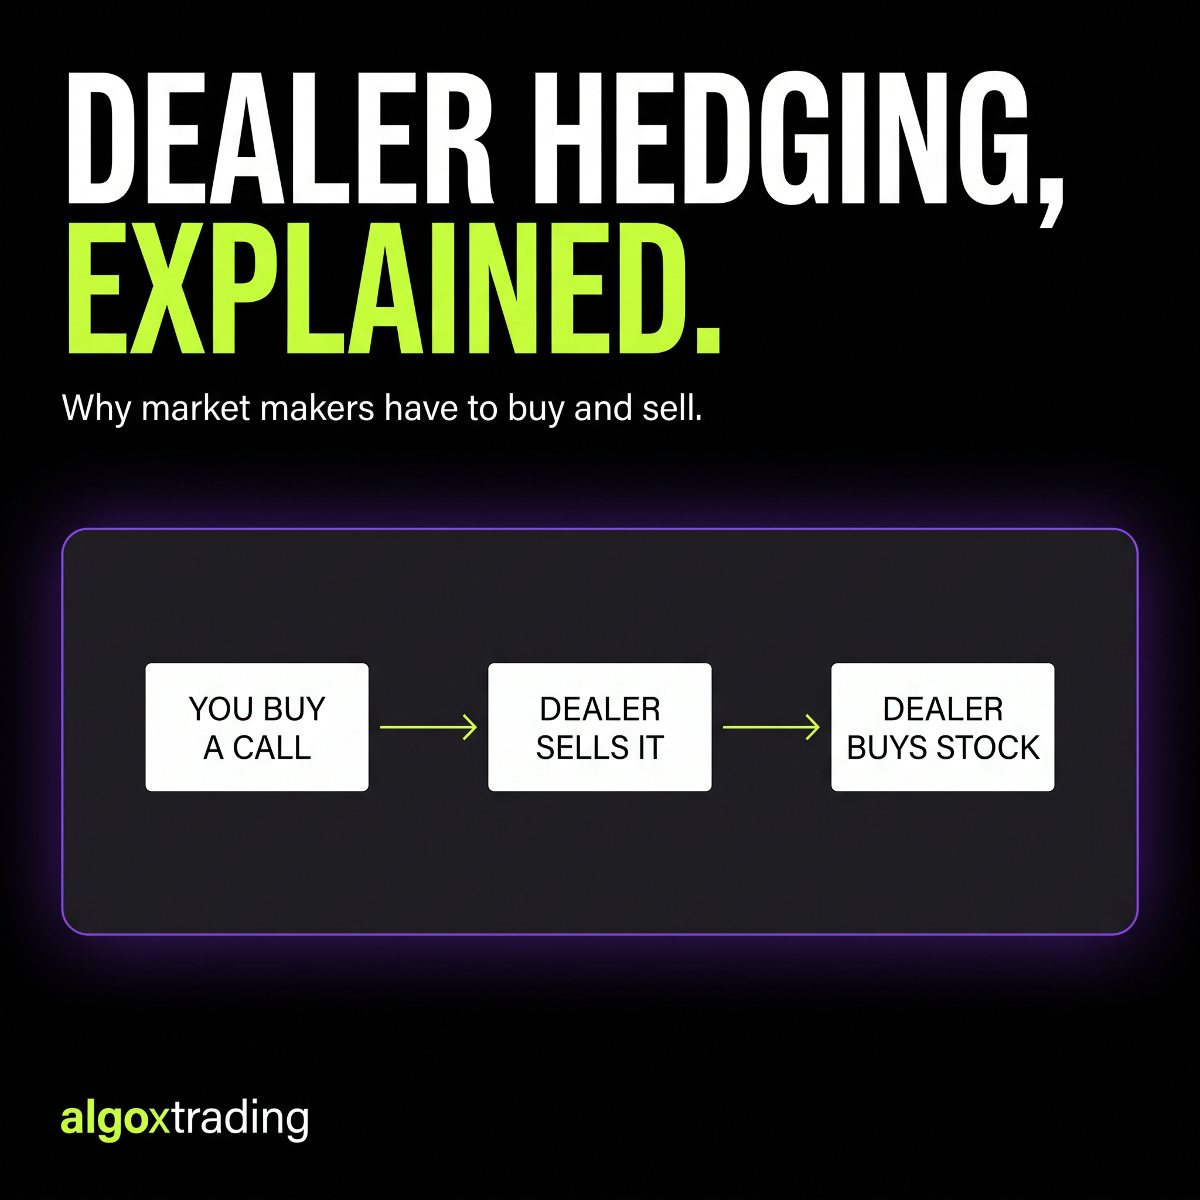
Every option you buy is sold to you by a market maker (a "dealer"). They don't want a directional bet — they make money on the spread, not on guessing the market. So the moment they take the other side of your trade, they hedge it by buying or selling the underlying stock to stay neutral. Here's the key: as price moves, how much stock they need to hold changes — and that re-hedging is a real flow that pushes the market around. Gamma is just the rate at which their required hedge changes. GEX adds it all up across every strike.
Positive gamma vs negative gamma — the whole ballgame
There are only two regimes, and they behave like different markets:
| Positive (long) gamma | Negative (short) gamma | |
|---|---|---|
| Dealers… | Sell strength, buy weakness | Buy strength, sell weakness |
| Effect on price | Suppresses / dampens | Amplifies / accelerates |
| The tape feels… | Grindy, range-bound, mean-reverting | Trending, jumpy, air pockets |
| Where price wants to go | Pinned to high-gamma strikes | Away from them, fast |
| How to trade it | Fade the extremes of the range | Go with momentum; respect stops |
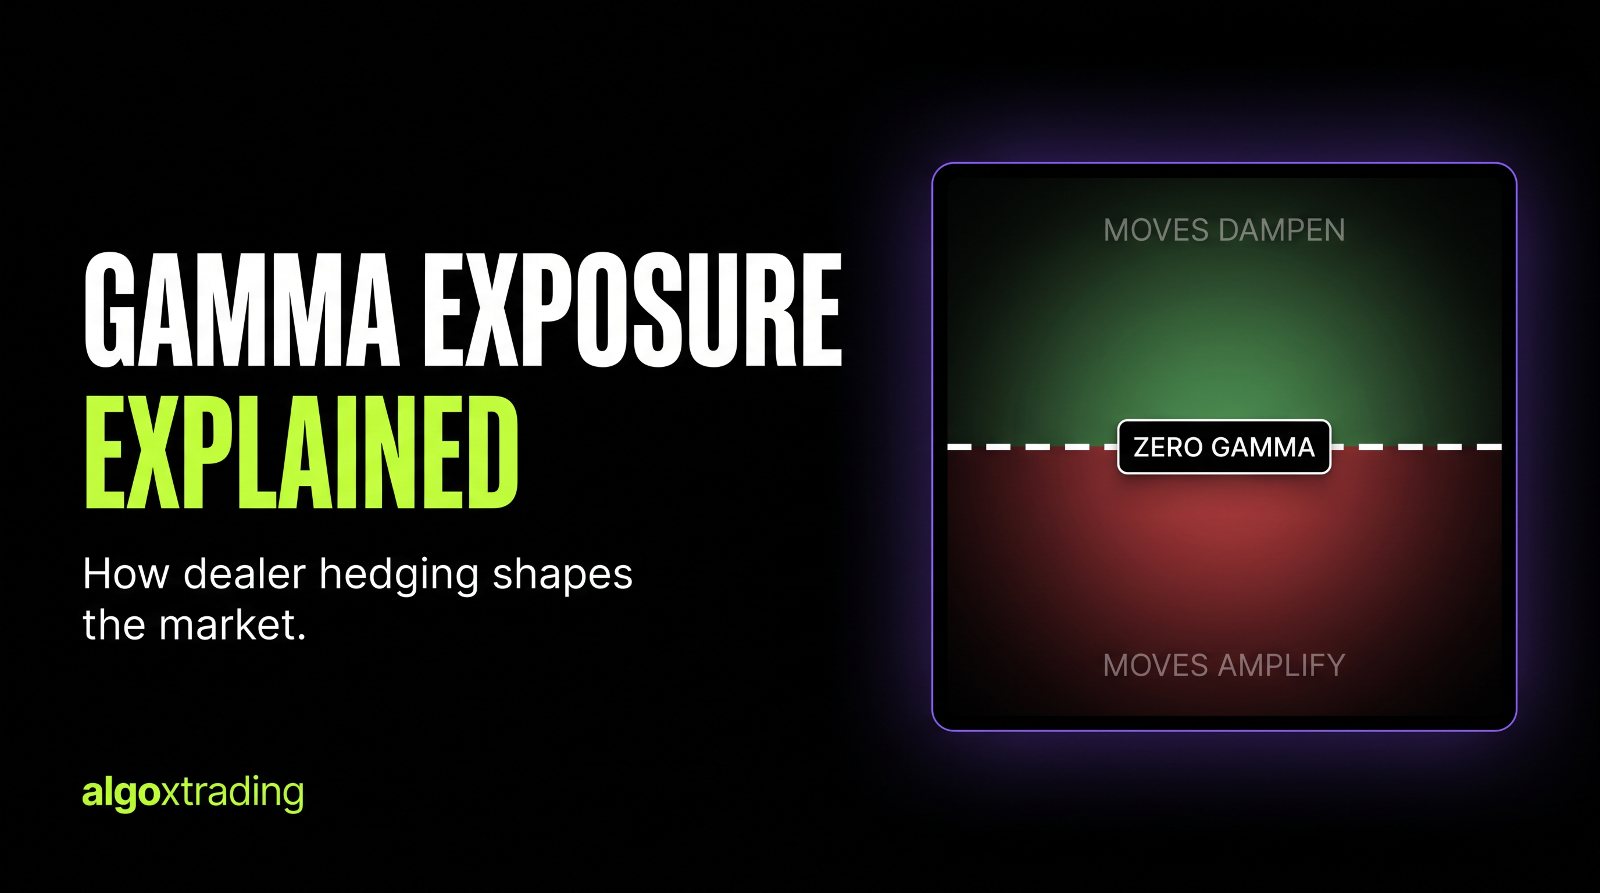
In positive gamma, dealer hedging leans against you — a rally makes them sell, capping it; a dip makes them buy, cushioning it. The market coils. In negative gamma the hedging feeds the move — a dip forces them to sell more, which deepens the dip, which forces more selling. That's how a quiet market turns into a trend day or a flush with no headline attached.
The three levels that matter
Every gamma map comes down to three lines:
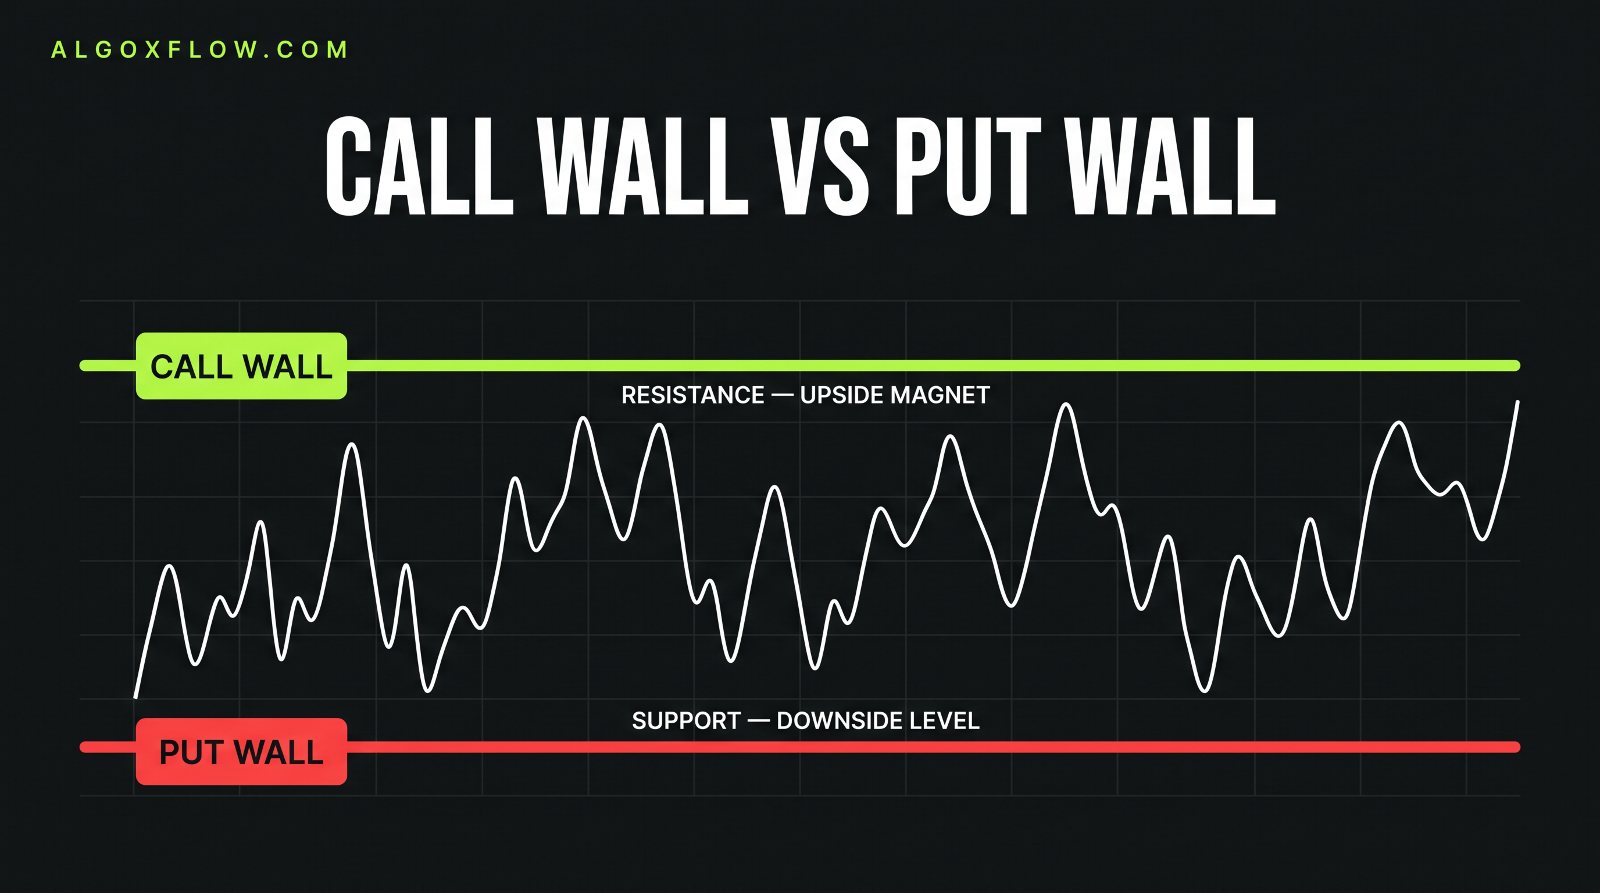
- Call wall — the strike with the biggest positive gamma. Acts as a magnet and resistance; price tends to stall into it. A clean break above can "un-pin" the market and open a vacuum higher.
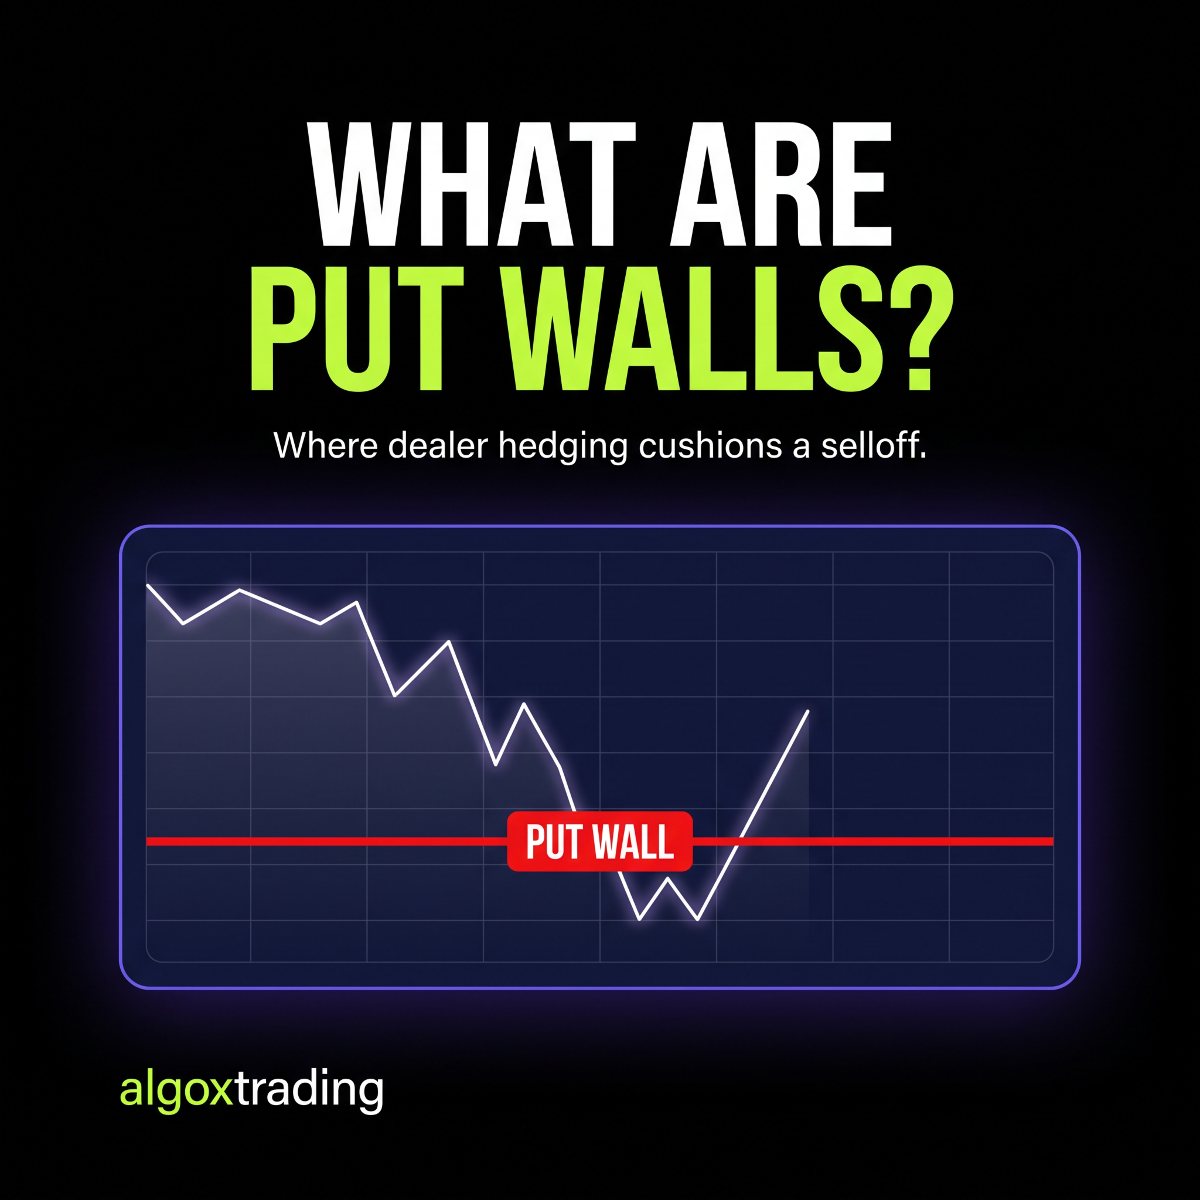
- Put wall — the biggest downside-gamma strike. In positive gamma it can be support; but once you're below the flip it becomes a through-level — break it and there's an air pocket beneath.
- Zero-gamma flip — the price where net gamma crosses zero and the regime changes. This is the most important level on the map, because reclaiming or losing it changes how price behaves, not just where it is.
Why most GEX numbers you see are wrong
This is the part almost nobody writes about, and it explains how two "gamma maps" of the same ticker can disagree completely.
A gamma flip is found by walking the strike ladder and adding net gamma until the running total crosses zero. That is easy to code and easy to get wrong, because where you start the walk decides the answer. Our own SPX map once returned a zero-gamma flip of 200.57 while the index traded near 7,665 — a level 97% below spot, produced by beginning the cumulative walk at the very bottom of a chain that runs from single digits into five figures. The arithmetic was correct. The number was worthless.
The fix was to window the walk to strikes within roughly ±20% of spot and reject any flip outside a sane band. Every gamma figure on this site is calculated that way now. If a free calculator hands you a flip nowhere near the current price, that is what has happened to it.
Data entitlement matters just as much, and it fails quietly rather than loudly. Index options are licensed separately from equity options at most vendors, and one of ours returns HTTP 200 with NOT_ENTITLED buried in the response body — so naive code reads an error as a successful empty chain and publishes a confident zero. SPX here is read from a different vendor for exactly that reason, and where a vendor's own total-gamma figure could not be reconciled we publish nothing rather than a number we cannot defend.
Net GEX is not the regime — and confusing them costs money
This is the single thing I would most want a newer trader to get right, and it is stated wrongly nearly everywhere.
A ticker's net GEX is dealer gamma summed across every strike on the board. Whether spot sits above or below the flip is the local regime at the current price. Those two can disagree, and when they do the local one governs what dealers are actually doing.
A live example: NVDA screened with positive net GEX while spot sat at 214.04 against a flip of 218.68 — below it. Read the headline number and you conclude dealers are absorbing moves and buying dips. Read the level and you get the opposite, correct answer: down there they sell into weakness and the move gets amplified. Anyone trading the first reading was positioned backwards.
I know precisely how easy that mistake is, because an automated draft on our own desk made it — confidently, in a paragraph that would otherwise have gone out under my name. Net gamma is context. The flip is the trade.
Two trades: one where the level held, one where it did not
Both are in the public record, which begins 12 August 2026 and currently holds 105 closed trades — 70 wins, 30 losses, a 70% win rate, average win +51.8% against an average loss of −42.4%. Everything below can be checked there.
The one that worked: CRWV, +300%
CRWV 90C expiring 8/14, opened 12 August, closed +300% — the best trade on the board so far. Two-day calls only behave that way when hedging flow works with the position instead of against it. A short-dated call bought into positive gamma above the call wall tends to bleed, because dealers sell every push into it. The setup that pays is the mirror image, and the gamma map is how you tell the two apart before paying for the contract.
The one that did not: AVGO, −100%
AVGO 422.5C expiring 8/14, a total loss — the worst trade in the record, and by far the more useful of the two.
A 100% loss on a two-day call is rarely a story about direction. It is a story about time. Gamma tells you how dealers will hedge if price reaches a level. It says nothing about whether price gets there before the contract expires. On a 0DTE or 2DTE call, theta charges rent by the hour on a thesis that needs room to be right, and being eventually correct pays exactly nothing.
It is also why those headline numbers should be read as a pair. A 70% win rate alongside an average loss of −42.4% only works because the average win is larger — not because the losses are small. Anyone selling gamma levels as a system that avoids losses is selling something other than gamma levels.
GEX vs options flow — they're not the same thing
People mix these up. Options flow is the live activity — the sweeps and blocks hitting the tape right now, showing what traders are doing. GEX is the terrain that activity happens on — a positioning map built from open interest showing where dealers are forced to hedge. Flow tells you the bet; GEX tells you how the field is tilted. Use them together and a big bullish sweep into a call wall reads very differently than the same sweep with clear air above.
Frequently asked
What does GEX (gamma exposure) tell you?
It tells you how dealers are likely to hedge, and therefore whether they'll dampen or amplify the market's moves. Positive gamma = they sell strength and buy weakness (suppresses volatility, pins price). Negative gamma = they chase the move (accelerates it). It's a map of forced flows, not a directional signal.
What's the difference between positive and negative gamma?
Positive (long) gamma means dealers trade against the move — a calm, mean-reverting, range-bound tape that pins near big strikes. Negative (short) gamma means dealers trade with the move — a trending, volatile tape where dips extend and rallies run. The zero-gamma flip is the price where the market crosses between the two.
What is the zero-gamma flip level?
It's the price where net dealer gamma crosses zero. Above it the market is usually positive-gamma (suppressed, range-bound); below it, negative-gamma (amplified, trending). Reclaiming or losing the flip is the single most important level on a gamma map because it changes how price behaves.
What are the call wall and put wall?
The call wall is the strike with the largest positive gamma — a magnet and resistance. The put wall is the largest downside-gamma strike — support in positive gamma, but a through-level once the market is below the flip, where a clean break opens an air pocket lower.
Is GEX the same as options flow?
No. Flow shows what traders are buying and selling right now (the sweeps and blocks). GEX is a positioning map from open interest showing where dealers are forced to hedge. Flow is the activity; GEX is the terrain. They're most powerful used together.
Why does my gamma flip look nowhere near the current price?
Almost always a calculation bug rather than a signal. A cumulative walk across the whole strike ladder anchors the flip to the bottom of the chain — ours once returned 200.57 for SPX trading near 7,665. Restricting the walk to strikes around spot fixes it. Sanity-check any flip against spot before trading off it.
Can a stock have positive net GEX and still be in negative gamma?
Yes, and it is the most common misreading. Net GEX sums every strike; the flip tells you the regime at the current price. NVDA recently screened positive net GEX with spot below its flip — dealer hedging was amplifying moves, the opposite of what the headline number implied. When the two disagree, the flip governs.
Do gamma levels predict where price will go?
No. They describe where hedging pressure sits if price gets there. Our worst logged trade was a two-day AVGO call that went to zero — the level was real, the move simply did not arrive before expiry. On short-dated contracts, timing beats structure.
See the SPY gamma map every morning
Want to see it right now? Our free Gamma Exposure Map plots the flip, walls and max pain for any ticker live. Then go premium: we drop the SPY dealer-gamma map before the open — call wall, put wall, zero-gamma flip — with a scenario-by-scenario plan around it. Stop guessing which regime you're in; trade the map.
Get the morning's biggest flow in your inbox
The top conviction names, the day's key levels and the heaviest options flow — free, every morning. No card, no Discord required.
No spam. Unsubscribe anytime. Just the daily flow.