 ← AlgoxFlow
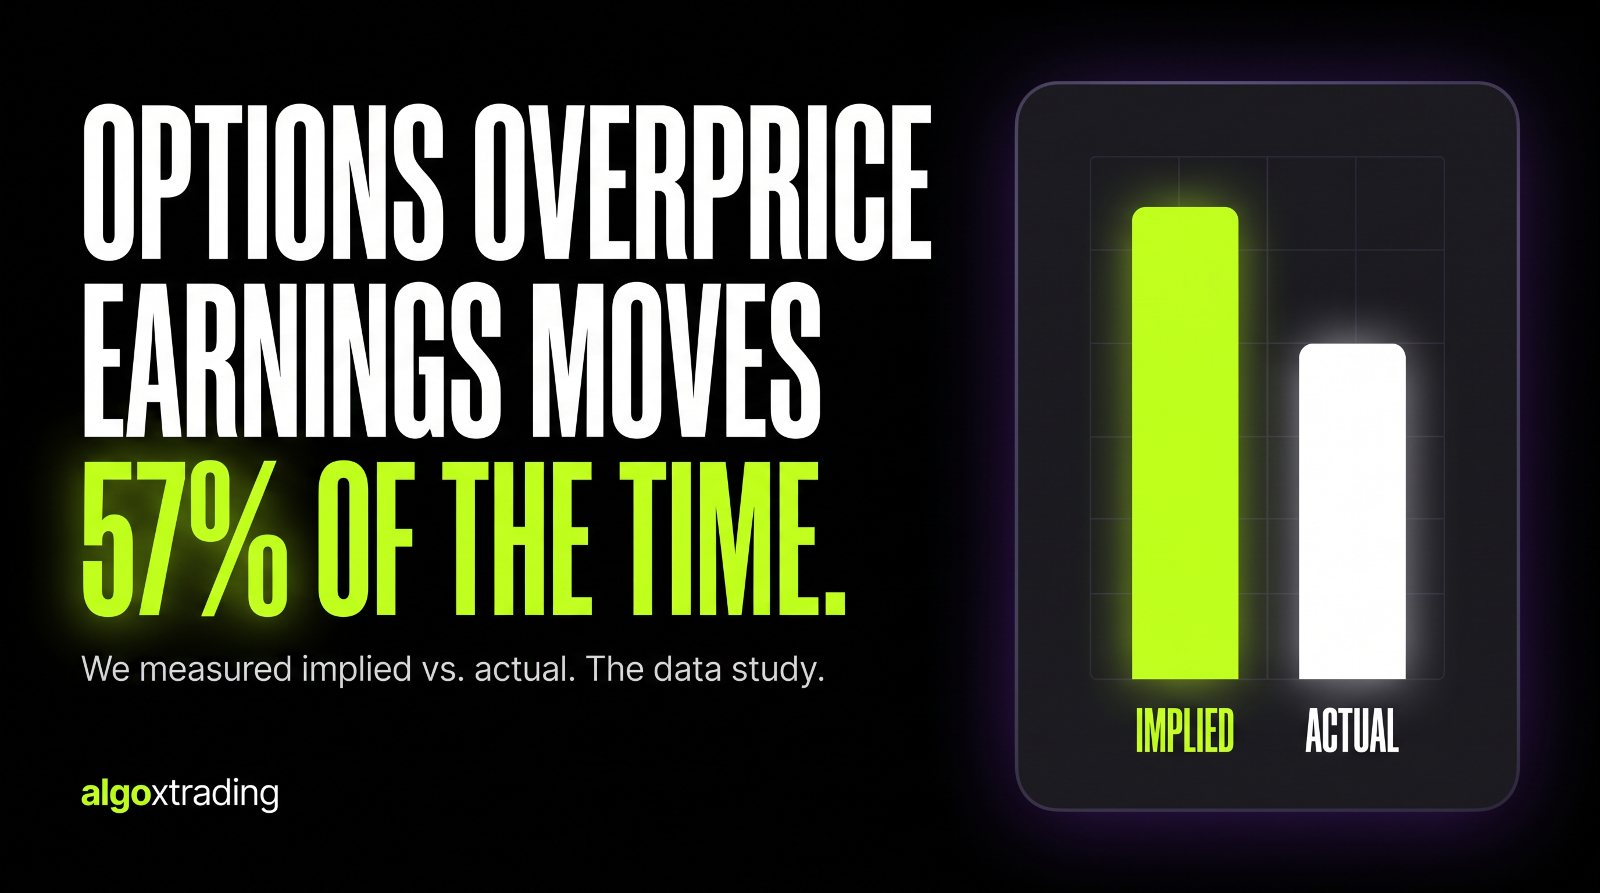
Options overpriced the earnings move 57% of the time
We pulled every earnings report we could get clean data for — 2,422 prints across 129 optionable US stocks, 2007 to 2026 — and compared what the options market priced in beforehand against what the stock actually did the next day. The headline is what most traders expect. What's underneath it isn't.
The part that matters: 57% wins is still not an edge
"Options overprice earnings" is received wisdom, and the 57.4% number supports it. So sell the straddle every time and collect, right?
No — and this is the finding worth taking away. The wins are smaller than the losses.
| Outcome | Count | Mean implied | Mean actual | Premium seller |
|---|---|---|---|---|
| Options overpriced | 1,391 (57.4%) | 8.10% | 3.77% | +4.33 pts |
| Options underpriced | 1,031 (42.6%) | 6.92% | 12.11% | −5.19 pts |
| Net, per print | 2,422 | 7.60% | 7.32% | +0.28 pts |
You win 57% of the time and clear 0.28 percentage points per print before commissions, slippage and assignment risk. That is not an edge — that is the market being approximately efficient and charging you a fee to discover it.
The distribution is barbelled, not clustered
Actual move as a multiple of the implied move. If options were well-calibrated you'd expect a hump around 1.0×. That's not what happens:
30.8% of prints came in under half the implied move. Another 11.3% more than doubled it. The single most common bucket is 1–1.5× — slightly more than priced. Earnings aren't mostly-quiet-with-rare-surprises; they're genuinely bimodal, and the average hides both halves.
It's getting slightly worse for buyers
| Year | Prints | % overpriced | Median ratio |
|---|---|---|---|
| 2026 (YTD) | 339 | 59.3% | 0.78 |
| 2025 | 512 | 59.8% | 0.81 |
| 2024 | 507 | 52.1% | 0.95 |
| 2023 | 478 | 57.1% | 0.85 |
| 2022 | 424 | 58.3% | 0.84 |
2024 was the outlier — options were close to fairly priced. 2025 and 2026 have been the most overpriced years in the sample. Buy an earnings straddle today and you're paying more of a premium than the long-run average.
Where options are most overpriced
Per-ticker, minimum 8 reports, ranked by median actual/implied ratio. These are the names where the options market has most consistently charged too much:
| Ticker | Reports | % overpriced | Mean implied | Mean actual | Median ratio |
|---|---|---|---|---|---|
| HUT | 18 | 78% | 27.2% | 9.1% | 0.37 |
| RKLB | 18 | 67% | 11.0% | 8.7% | 0.38 |
| SMR | 16 | 81% | 11.3% | 6.6% | 0.39 |
| NIO | 18 | 78% | 9.4% | 5.2% | 0.42 |
| RGTI | 15 | 87% | 18.8% | 8.2% | 0.45 |
| PFE | 20 | 80% | 3.6% | 2.2% | 0.46 |
| BBAI | 19 | 84% | 17.3% | 11.5% | 0.49 |
| MCHP | 19 | 74% | 7.7% | 4.8% | 0.50 |
Note the pattern: high-volatility speculative names — crypto miners, small-cap nuclear, quantum, pre-revenue AI. The options market knows these are volatile and prices in a huge move, and the stock still routinely fails to deliver it. HUT's options have priced an average ±27.2% move and the stock has averaged 9.1%.
Where options are most underpriced
The opposite end — names that routinely blow through what was priced in:
| Ticker | Reports | % overpriced | Mean implied | Mean actual | Median ratio |
|---|---|---|---|---|---|
| SHOP | 19 | 26% | 9.1% | 14.2% | 1.71 |
| MDB | 18 | 22% | 11.8% | 18.2% | 1.56 |
| TSLA | 19 | 37% | 6.2% | 8.9% | 1.51 |
| SNOW | 18 | 39% | 9.7% | 14.0% | 1.48 |
| TEAM | 18 | 44% | 9.9% | 12.8% | 1.44 |
| UNH | 19 | 32% | 3.6% | 5.8% | 1.38 |
| DELL | 19 | 37% | 7.1% | 11.6% | 1.32 |
| WFC | 19 | 42% | 3.4% | 3.9% | 1.30 |
SHOP has exceeded its implied move in 74% of its last 19 reports — priced ±9.1%, delivered 14.2% on average. Enterprise software dominates this list, which is the mirror image of the overpriced table: boring-looking names with genuinely fat tails.
The biggest misses of 2026
| Ticker | Date | Implied | Actual | Multiple |
|---|---|---|---|---|
| SLB | 2026-07-24 | ±2.4% | +11.0% | 4.6× |
| RKLB | 2026-05-07 | ±7.4% | +34.2% | 4.6× |
| HUT | 2026-05-06 | ±8.5% | +35.3% | 4.2× |
| UNH | 2026-01-27 | ±5.1% | −19.6% | 3.8× |
| DELL | 2026-05-28 | ±8.7% | +32.8% | 3.8× |
| SNOW | 2026-05-27 | ±12.1% | +36.5% | 3.0× |
Method
Sample. 129 liquid optionable US stocks, every earnings report with both a recorded options-implied expected move and a realised one-day post-earnings move. 2,422 usable prints, Jan 2007 – Aug 2026. ETFs excluded (no earnings). Tickers with fewer than 8 reports are excluded from the per-ticker tables but included in the aggregate.
Definitions. Implied = the options-implied expected move going into the print. Actual = the absolute one-day move after it. Ratio = |actual| ÷ implied. "Overpriced" means ratio < 1.
A statistical note, because it changes the answer. We report the median ratio and the ratio of means, not the mean of ratios. The mean of ratios comes out at 1.116, which would suggest options underprice moves — but that figure is an artifact. A print with a 1% implied move and a 6% actual scores 6.0 and drags the mean upward; the ratio is floored at zero and unbounded above, so it is inherently right-skewed. The median (0.840) and the ratio of means (0.963) both say the opposite, and both are robust to that skew. If you see a study claiming options systematically underprice earnings, check which statistic it used.
Source. Earnings history and implied moves via Unusual Whales. Analysis is ours. Figures are point-in-time as of 6 August 2026.
Get the data
Per-ticker summary statistics for all 129 names — reports, % overpriced, median ratio, mean implied, mean actual, % moved up. Free, CC BY 4.0. Use it, cite it, argue with it.
⬇ Download the CSV (129 tickers)
We publish the aggregate table rather than the 2,422 raw print-level rows, since the underlying per-report data is licensed from a vendor. The summary statistics are our own derived analysis.
Frequently asked
Do options overprice earnings moves?
Usually, but not by enough to trade blindly. Across 2,422 earnings reports in 129 optionable US stocks between 2007 and 2026, the actual one-day move came in below the options-implied move 57.4% of the time, and the median stock moved just 84% of what was priced in. However, selling that premium every time netted only +0.28 percentage points per report, because the losses on underpriced prints (−5.19 points) were larger than the gains on overpriced ones (+4.33 points).
How often do stocks beat their implied move on earnings?
42.6% of the time the actual move met or exceeded the implied move. 24.3% of reports produced a move at least 1.5× the implied, and 11.3% more than doubled it. At the other end, 30.8% came in under half the implied move.
Which stocks have the most overpriced earnings options?
By median actual/implied ratio (minimum 8 reports): HUT (0.37), RKLB (0.38), SMR (0.39), NIO (0.42), RGTI (0.45), PFE (0.46), BBAI (0.49) and MCHP (0.50). The pattern is high-volatility speculative names — crypto miners, small-cap nuclear, quantum computing — where the options price an enormous move that the stock repeatedly fails to deliver. HUT's options have averaged a ±27.2% implied move against an average actual move of 9.1%.
Which stocks beat their implied move most often?
SHOP (median ratio 1.71, exceeded its implied move in 74% of 19 reports), MDB (1.56), TSLA (1.51), SNOW (1.48), TEAM (1.44), UNH (1.38) and DELL (1.32). Enterprise software is heavily represented — names that look stable but carry genuinely fat tails on guidance.
Is selling earnings premium profitable?
Marginally, and not reliably. The win rate is 57.4%, but the average win is smaller than the average loss, leaving roughly +0.28 percentage points per report before commissions, slippage and assignment risk. A strategy that wins often and loses big is also the profile most likely to blow up on a single print — 3.0% of reports produced a move over 3× the implied.
Get the next update when it drops 🧲
We refresh this study each season and send the new numbers, plus the daily gamma levels before the open. No spam.
No spam · unsubscribe in one click
Check any ticker before its next print
The free earnings analyzer shows the upcoming implied move against how that specific stock has actually reacted — the same data behind this study, per name.
More free reads: the blog · what is implied volatility · sweeps vs blocks · free tools