1 · The number that kills the rule
aggregate results
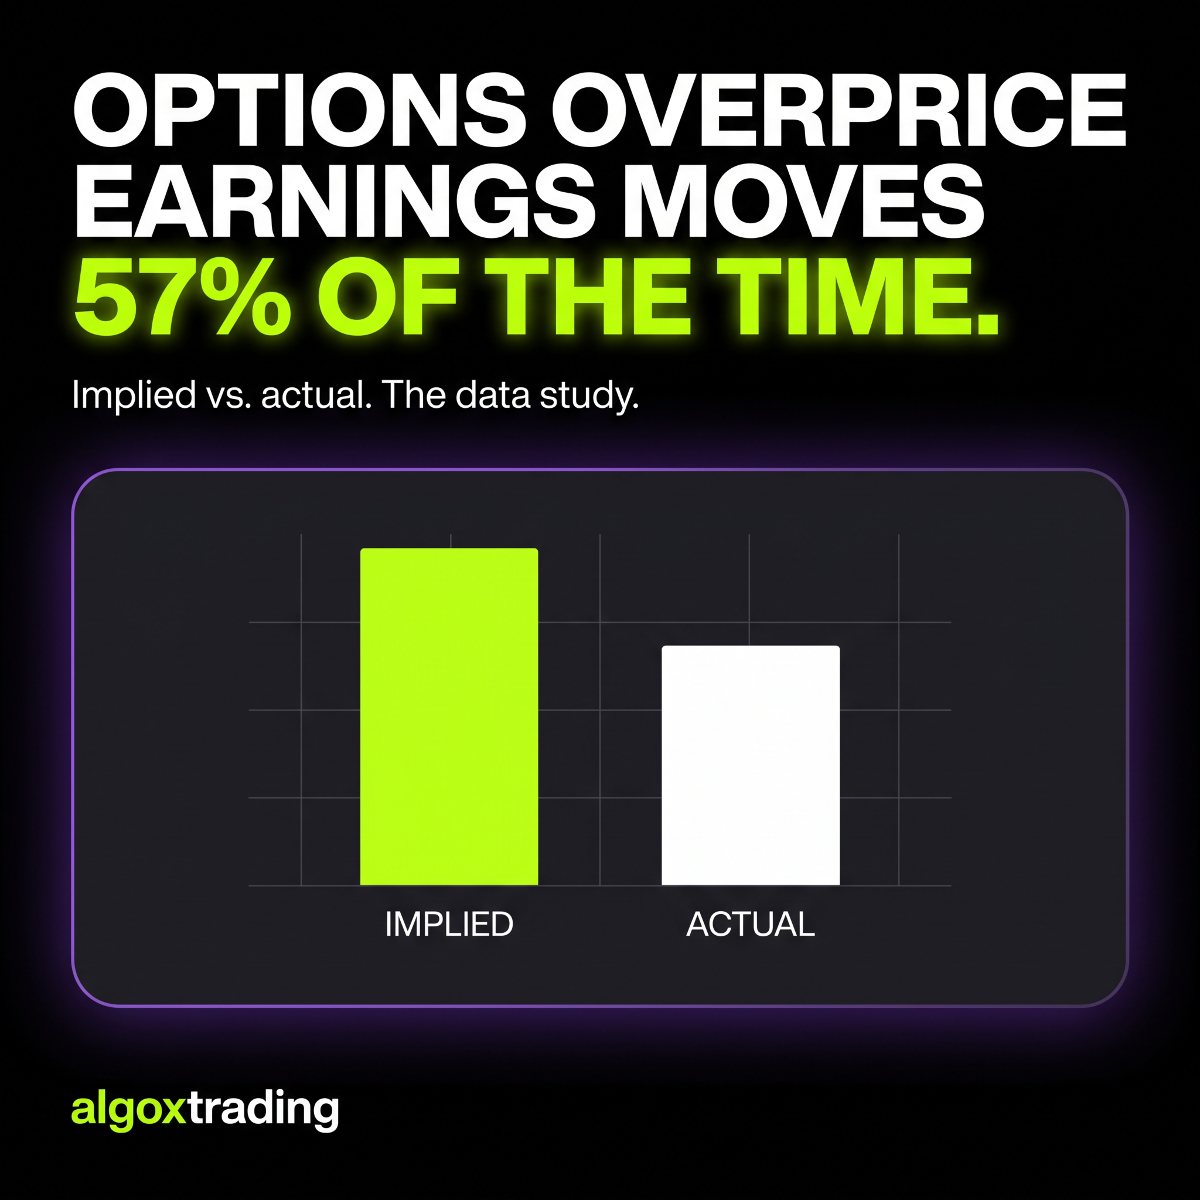
Here's the finding that reframes everything. Across the whole sample, the median stock's average implied move into earnings was 7.0%. The median stock's average actual move was 6.9%.
One tenth of a percentage point. In aggregate, the options market prices earnings moves almost exactly right.
Earnings prints studied
2,422
across 129 tickers
Median implied move
7.0%
what options priced
Median actual move
6.9%
what actually happened
Overpriced, median name
57.9%
of the time — a coin flip with a lean
So the "sell premium into earnings" edge isn't a market-wide effect at all. A 57.9% hit rate on a bet that loses more when it loses than it wins when it wins is not an edge — it's the reason most premium sellers give back a quarter's gains in one print. The real edge is in which names deviate, and by how much.
2 · The 40 names where options are too cheap
actual move exceeds implied
40 of the 129 tickers we studied moved more than the options priced, more than half the time. On these names, selling earnings premium has been the wrong side of the trade — repeatedly, not occasionally.
The ratio column is the median actual move divided by the implied move. Above 1.00 means the stock routinely blows through what was priced.
| Ticker | Prints | Implied | Actual | Ratio | Overpriced |
|---|
| MDB | 18 | 11.8% | 18.2% | 1.56× | 22.2% |
| SHOP | 19 | 9.1% | 14.2% | 1.71× | 26.3% |
| INTC | 19 | 7.1% | 9.6% | 1.26× | 26.3% |
| UNH | 19 | 3.6% | 5.8% | 1.38× | 31.6% |
| QCOM | 20 | 5.6% | 6.2% | 1.14× | 35.0% |
| AMGN | 20 | 3.5% | 4.6% | 1.29× | 35.0% |
| DELL | 19 | 7.1% | 11.6% | 1.32× | 36.8% |
| TSLA | 19 | 6.2% | 8.9% | 1.51× | 36.8% |
| AMZN | 19 | 5.9% | 7.1% | 1.09× | 36.8% |
| LLY | 19 | 4.5% | 6.2% | 1.21× | 36.8% |
| SPOT | 19 | 8.6% | 9.6% | 1.34× | 36.8% |
| NFLX | 18 | 7.7% | 9.4% | 1.18× | 38.9% |
| UPST | 19 | 17.6% | 23.3% | 1.19× | 42.1% |
MDB is the standout. Options priced an 11.8% move; the stock delivered 18.2%. It was overpriced only 22.2% of the time — meaning in more than three of every four reports, whoever bought that straddle was right on magnitude. See MDB's full print history →
3 · And the names where it's absurdly expensive
the other tail
The overpriced tail is far more extreme than the underpriced one — and that asymmetry is the most useful thing in this study.
| Ticker | Prints | Implied | Actual | Gap | Overpriced |
|---|
| HUT | 18 | 27.2% | 9.1% | −18.1 pts | 77.8% |
| RGTI | 15 | 18.8% | 8.3% | −10.6 pts | 86.7% |
| BITF | 17 | 17.2% | 9.8% | −7.3 pts | 70.6% |
| SOUN | 16 | 15.2% | 8.8% | −6.3 pts | 93.8% |
| HIMS | 18 | 17.3% | 11.2% | −6.1 pts | 72.2% |
| BBAI | 19 | 17.3% | 11.5% | −5.8 pts | 84.2% |
| LCID | 19 | 13.6% | 8.7% | −4.8 pts | 89.5% |
| SMR | 16 | 11.3% | 6.6% | −4.7 pts | 81.3% |
| NIO | 18 | 9.4% | 5.2% | −4.2 pts | 77.8% |
SOUN was overpriced in 15 of its last 16 reports — 93.8%. HUT's options priced an average 27.2% swing and the stock delivered 9.1%: buyers paid three times the eventual move. These are not small inefficiencies.
4 · The pattern — and it isn't random
the actual takeaway
Read the two lists side by side and something jumps out.
The wildly overpriced names are retail speculation vehicles. SOUN, RGTI, BBAI, LCID, SMR, HUT, BITF, NIO — small-cap AI, quantum, nuclear, EV and crypto-mining stories. These are the tickers where retail buys weekly calls into earnings as a lottery ticket. That demand bids implied volatility to levels the underlying has never justified.
The underpriced names are institutional large caps — and disproportionately enterprise software. MDB, SHOP, ADBE, NFLX, SPOT, DELL, plus mega-caps like AMZN, TSLA, LLY and UNH. These report a single number (net retention, cloud growth, a guide) that can genuinely reprice the business, and the options market keeps under-respecting how violently a re-rating happens.
So the rule isn't "sell earnings premium." It's this: the crowd overpays for lottery tickets on story stocks and underpays for genuine repricing risk on quality large caps. Which side of an earnings trade you want depends on which kind of stock you're looking at — not on a market-wide maxim.
One more wrinkle worth having: some of these names carry a strong directional skew too. LRCX has the largest sample in our set at 68 prints and closed higher after 67.6% of them. BAC is up after 68.4% of 19. On the other side, LCID and BBAI have gone up after only 21.1% — expensive options and a downward bias.
5 · What this study can't tell you
the caveats that matter
The samples are small. Most tickers here have 15–21 prints; only LRCX has 68. A 22% hit rate over 18 observations is suggestive, not settled — the confidence interval on that is wide enough to drive a truck through.
Magnitude isn't profit. Knowing a stock tends to move more than priced does not mean buying the straddle makes money. You still pay the spread, and implied volatility collapses the morning after regardless of direction. A 1.19× ratio can still lose after IV crush and slippage.
Direction isn't included in the ratio. "Actual move" is the size of the post-earnings move, not its sign. A stock that reliably moves 1.5× what's priced will still take your premium if you picked the wrong side with a single-leg trade.
Regimes change. These windows span very different volatility environments. A name that was systematically overpriced through a speculative mania may be fairly priced once that mania ends — the retail-demand mechanism behind the mispricing is exactly the thing that can disappear.
Method: implied move is taken from the at-the-money straddle before the report; actual move is the underlying's move on the first session after. "Overpriced" counts prints where implied exceeded actual. Every figure on this page comes from our own earnings analyzer dataset — you can check any individual ticker's full print history yourself.
Free · every morning before the open
Get the pre-market edge in your inbox 🧲
The gamma map, the day's expected moves and the setups — free, before the bell.
No spam · unsubscribe in one click
Check any ticker before its next print
The earnings analyzer is free and covers every name in this study — implied vs actual, print by print. Premium members also get the ranked earnings board: which of this week's reports are priced richest and cheapest, before the bell.